How to Enable Volume Profile Study on Thinkorswim
Using a volume profile is a helpful study to use when day-trading futures or equities. The volume profile shows the volume amount that an asset traded at for a specific price level. Traders use the volume profile to identify imbalances in the market. These imbalances can indicate high-probability opportunities to enter or exit a trade.
thinkorswim is the proprietary trading platform for TD Ameritrade. Unfortunately, there is no out-of-the-box volume profile study built into the application. This article will show you how to set up a volume profile study.
setting up the study
Log in to thinkorswim and navigate to the Chart pane. Enter a symbol - /ES is a good example. Navigate to the studies and strategies window by clicking on the icon that looks like an erlenmeyer flask.

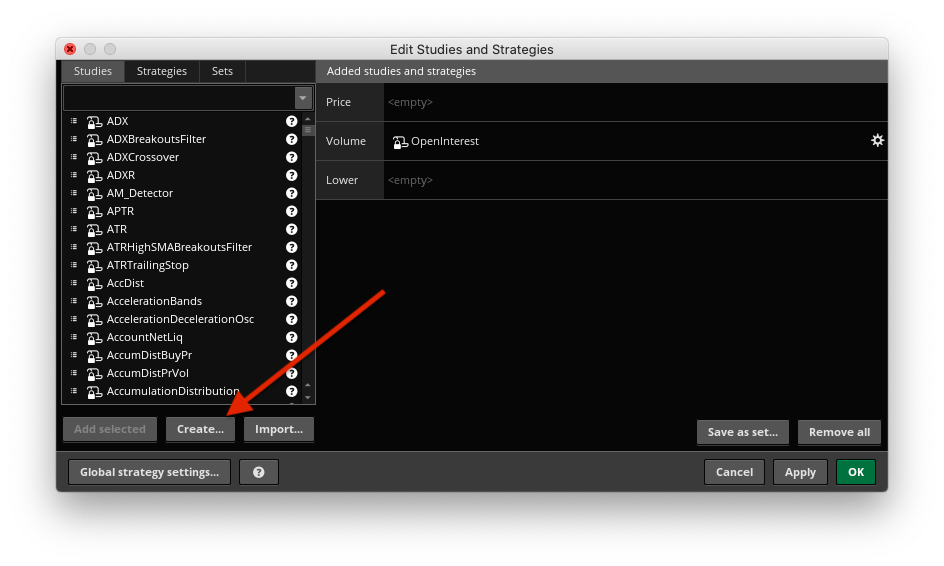
From there you'll have to create a new study. You can name it whatever you like, ExampleNewVolumeProfileStudy will be used in this example. Paste the following code into the thinkscript code box.
input pricePerRowHeightMode = {default TICKSIZE, AUTOMATIC, CUSTOM};
input customRowHeight = 1.0;
input timePerProfile = {CHART, MINUTE, FIVEMINUTE, QUARTERHOUR, default HALFHOUR, HOUR, DAY, WEEK, MONTH, "OPT EXP", BAR};
input multiplier = 1;
input onExpansion = no;
input profiles = 1000;
input showPointOfControl = yes;
input showValueArea = yes;
input valueAreaPercent = 70;
input opacity = 25;

def period;
def yyyymmdd = getYyyyMmDd();
def seconds = secondsFromTime(0);
def month = getYear() * 12 + getMonth();
def day_number = daysFromDate(first(yyyymmdd)) + getDayOfWeek(first(yyyymmdd));
def dom = getDayOfMonth(yyyymmdd);
def dow = getDayOfWeek(yyyymmdd - dom + 1);
def expthismonth = (if dow > 5 then 27 else 20) - dow;
def exp_opt = month + (dom > expthismonth);
switch (timePerProfile) {
case CHART:
    period = 0;
case MINUTE:
    period = floor(seconds / 60 + day_number * 24 * 60);
case FIVEMINUTE:
    period = floor(seconds / 300 + day_number * 24 * 12);
case QUARTERHOUR:
    period = floor(seconds / 900 + day_number * 24 * 4);
case HALFHOUR:
    period = floor(seconds / 1800 + day_number * 24 * 2);
case HOUR:
    period = floor(seconds / 3600 + day_number * 24);
case DAY:
    period = countTradingDays(min(first(yyyymmdd), yyyymmdd), yyyymmdd) - 1;
case WEEK:
    period = floor(day_number / 7);
case MONTH:
    period = floor(month - first(month));
case "OPT EXP":
    period = exp_opt - first(exp_opt);
case BAR:
    period = barNumber() - 1;
}

def count = CompoundValue(1, if period != period[1] then (count[1] + period - period[1]) % multiplier else count[1], 0);
def cond = count < count[1] + period - period[1];
def height;
switch (pricePerRowHeightMode) {
case AUTOMATIC:
    height = PricePerRow.AUTOMATIC;
case TICKSIZE:
    height = PricePerRow.TICKSIZE;
case CUSTOM:
    height = customRowHeight;
}

profile vol = volumeProfile("startNewProfile" = cond, "onExpansion" = onExpansion, "numberOfProfiles" = profiles, "pricePerRow" = height, "value area percent" = valueAreaPercent);
def con = compoundValue(1, onExpansion, no);
def pc = if IsNaN(vol.getPointOfControl()) and con then pc[1] else vol.getPointOfControl();
def hVA = if IsNaN(vol.getHighestValueArea()) and con then hVA[1] else vol.getHighestValueArea();
def lVA = if IsNaN(vol.getLowestValueArea()) and con then lVA[1] else vol.getLowestValueArea();

def hProfile = if IsNaN(vol.getHighest()) and con then hProfile[1] else vol.getHighest();
def lProfile = if IsNaN(vol.getLowest()) and con then lProfile[1] else vol.getLowest();
def plotsDomain = IsNaN(close) == onExpansion;

plot POC = if plotsDomain then pc else Double.NaN;
plot ProfileHigh = if plotsDomain then hProfile else Double.NaN;
plot ProfileLow = if plotsDomain then lProfile else Double.NaN;
plot VAHigh = if plotsDomain then hVA else Double.NaN;
plot VALow = if plotsDomain then lVA else Double.NaN;

DefineGlobalColor("Profile", GetColor(1));
DefineGlobalColor("Point Of Control", GetColor(5));
DefineGlobalColor("Value Area", GetColor(8));

vol.show(globalColor("Profile"), if showPointOfControl then globalColor("Point Of Control") else color.current, if showValueArea then globalColor("Value Area") else color.current, opacity);
POC.SetDefaultColor(globalColor("Point Of Control"));
POC.SetPaintingStrategy(PaintingStrategy.HORIZONTAL);
VAHigh.SetPaintingStrategy(PaintingStrategy.HORIZONTAL);
VALow.SetPaintingStrategy(PaintingStrategy.HORIZONTAL);
VAHigh.SetDefaultColor(globalColor("Value Area"));
VALow.SetDefaultColor(globalColor("Value Area"));
ProfileHigh.SetPaintingStrategy(PaintingStrategy.HORIZONTAL);
ProfileLow.SetPaintingStrategy(PaintingStrategy.HORIZONTAL);
ProfileHigh.SetDefaultColor(GetColor(3));
ProfileLow.SetDefaultColor(GetColor(3));
ProfileHigh.hide();
ProfileLow.hide();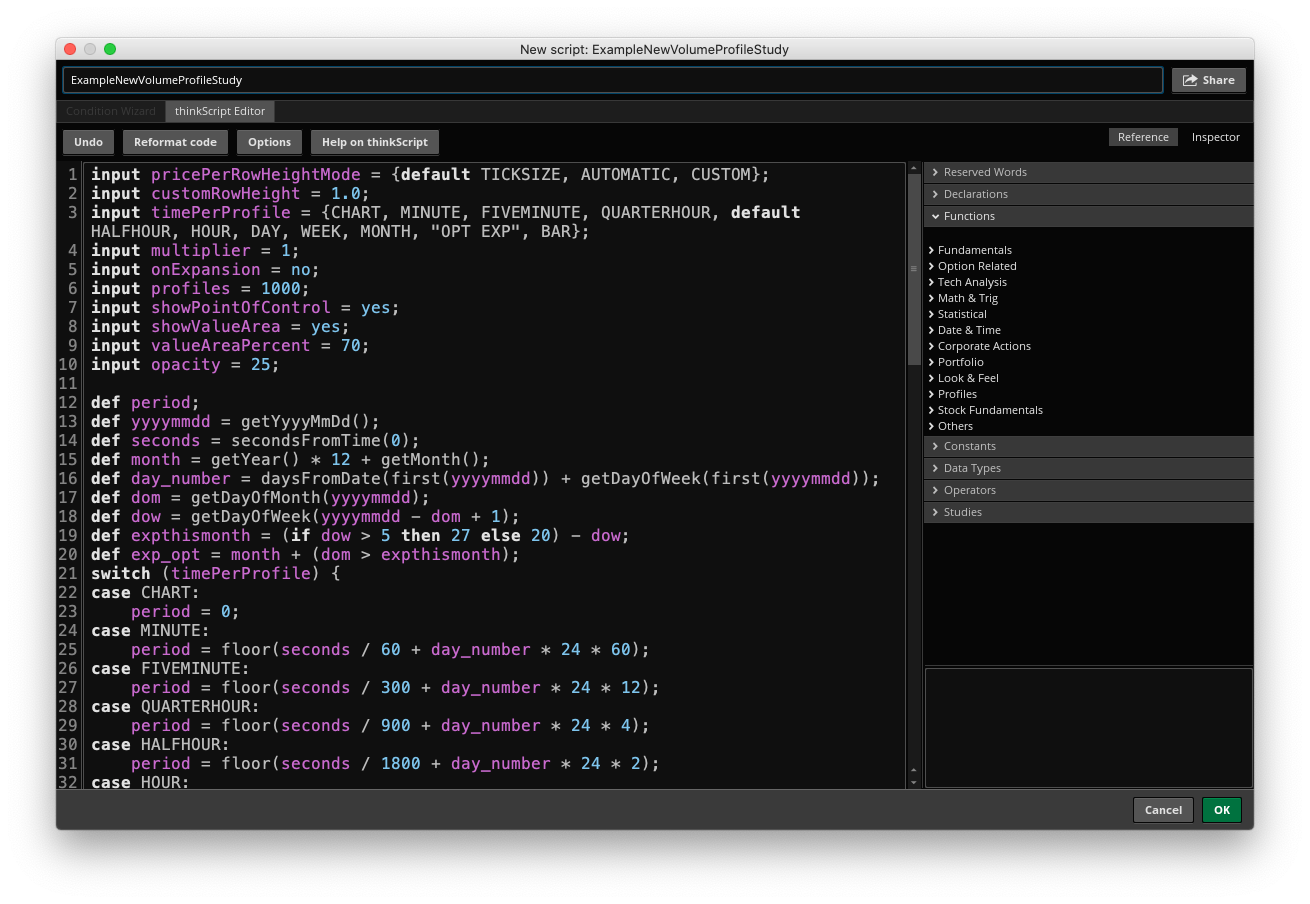
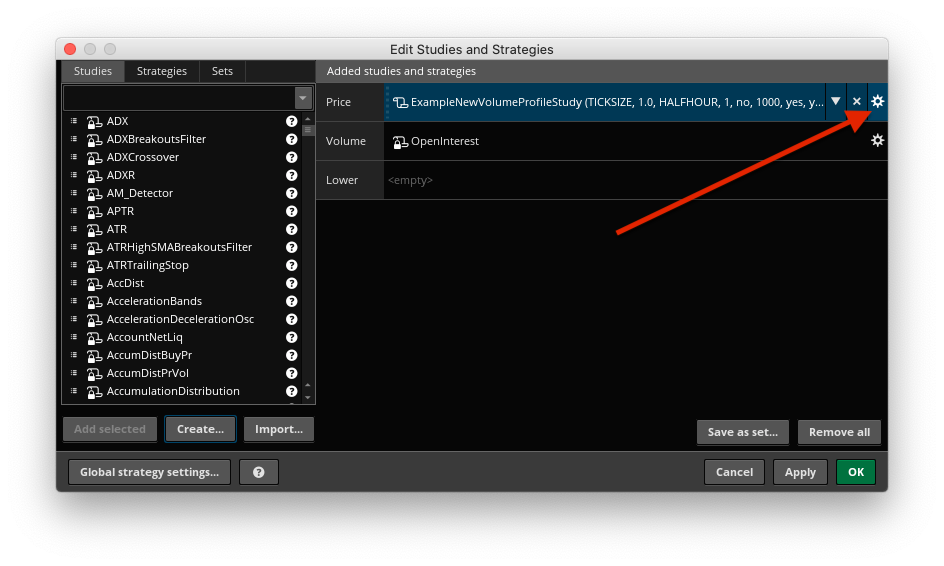
Click "OK" to create the study. The study should be set into the row for Price. Move it up if it isn't. Click the gear to edit the study settings.
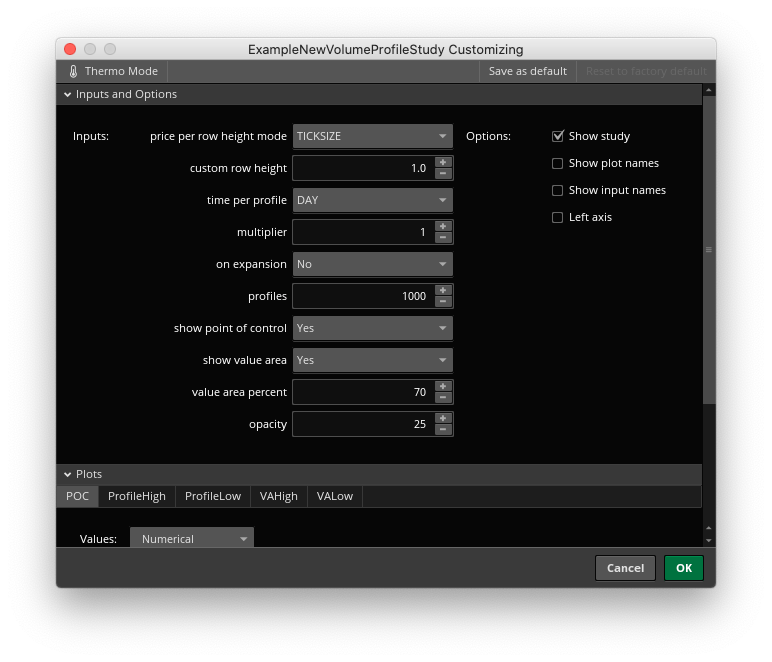
The settings for the study can be edited from this window. The time for profile must be greater than whatever the candle size currently specified in the chart is. My preference is to set the candle size to be hourly and the study to be daily.
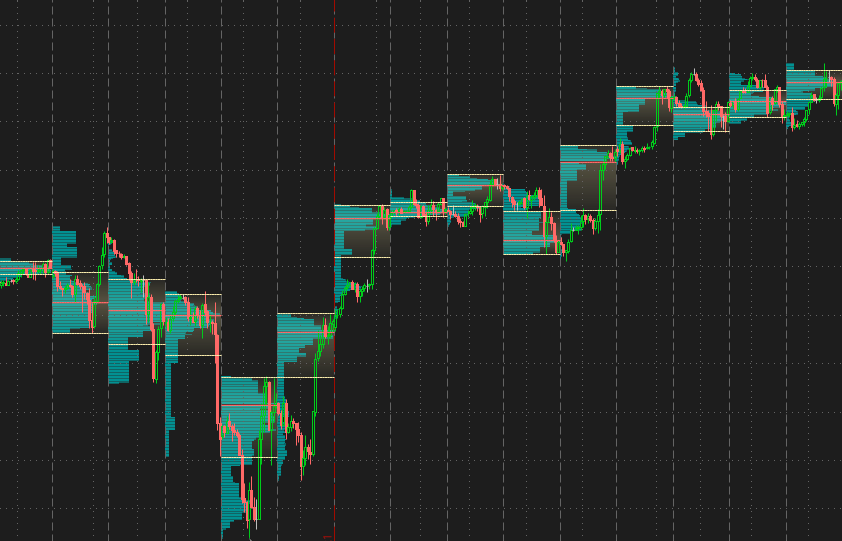
Click "OK" and "Apply" on the Edit Studies and Strategies window to save the study and add it to your chart. The completed result is below.
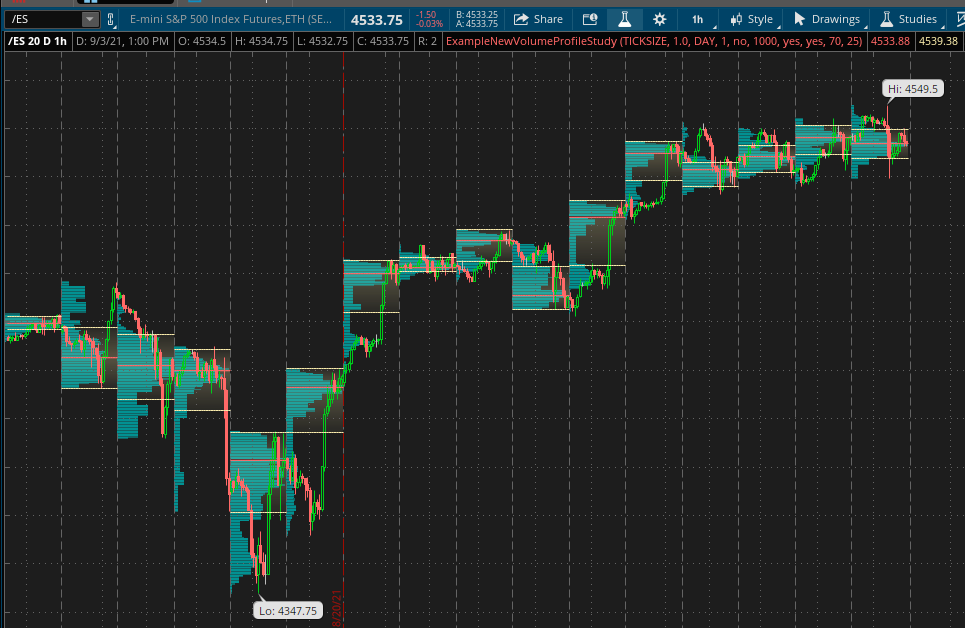
using the volume profile study
The volume profile study allows you to better visualize imbalances between buyers and sellers. Fatter (longer) bars of the profile show that more volume occurred at these price levels. Thin (shorter) bars of the profile show price levels that were visited briefly with little volume.
The red line in the middle of each (daily) profile indicates the point of control (POC), the price level where the greatest volume of trades occurred. The lines above and below the POC indicate the value area high and low (VAH/VAL). This 'value area' indicates where 70% (configurable) of the volume took place during the day. 30% of the volume would have taken place outside of this area.
The shape of the distribution can be used to understand the positioning of market participants. Many of the concepts from trading market profile can be adapted using this study - a recommended read is Jim Dalton's Markets in Profile.